A simple way to determine the thickness of thin samples
We can exploit optical effects to find the thickness of very thin, transparent samples by simple methods
The beautiful iridescent colors in soap bubbles and oil slicks on water are caused by interference color. This is a phenomenon where colors are produced through the constructive and destructive interference of light waves. This occurs when light is reflected from or transmitted through thin films, layers, or structures with thicknesses comparable to the wavelength of light
When light traverses a thin film, there are multiple reflections and transmissions at each boundary, with the total reflection and transmission the sum of each individually transmitted and reflected waves, as shown in the diagram below.

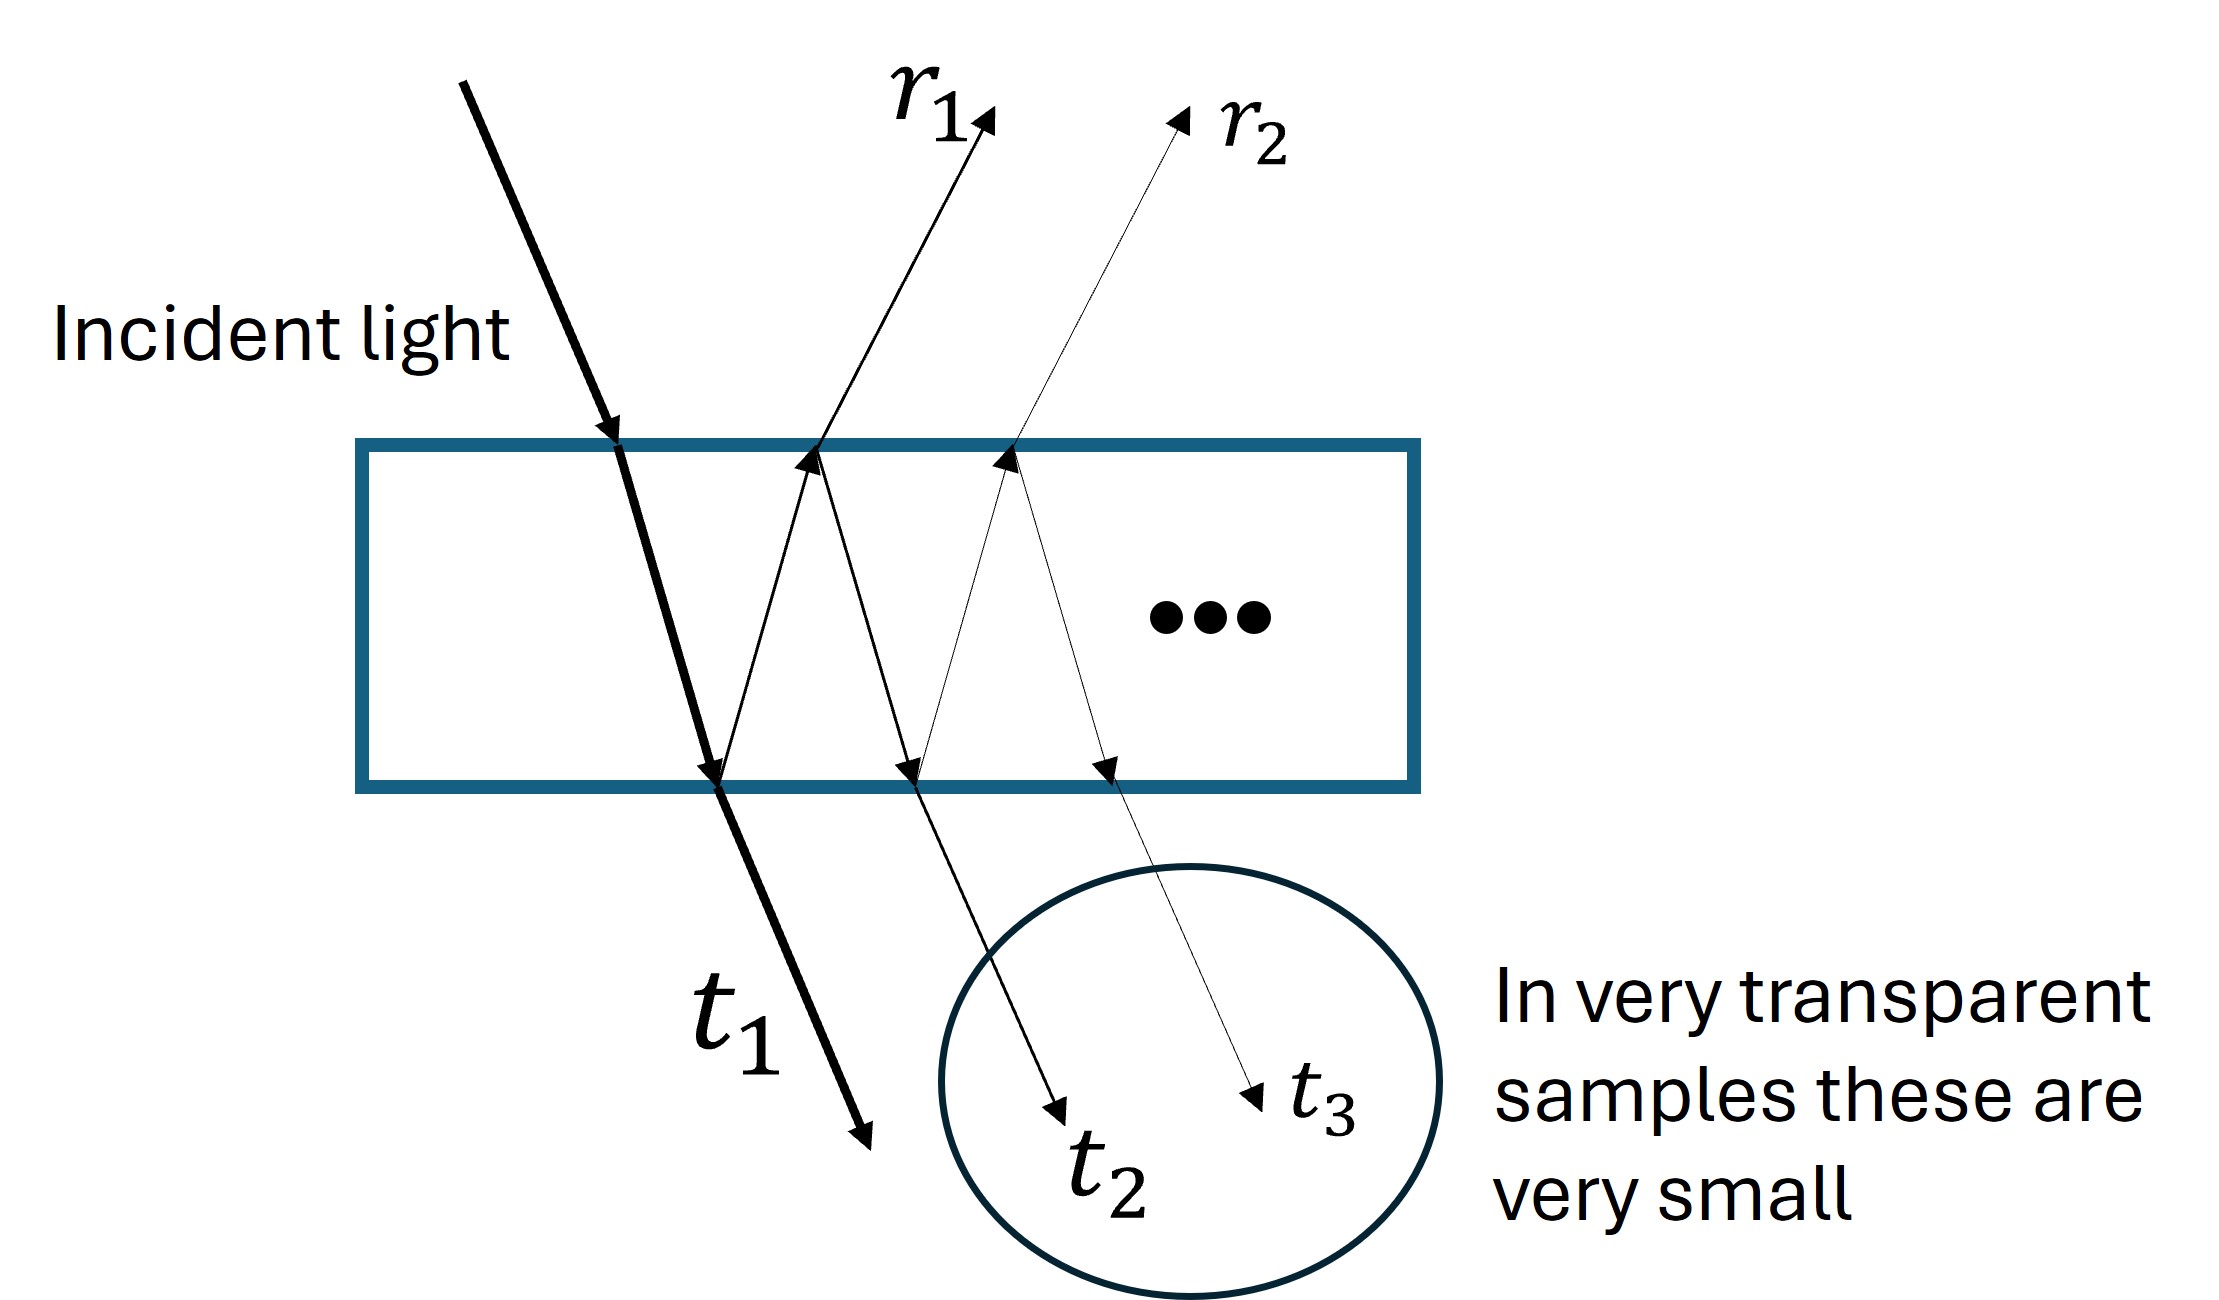
Each of the waves travels a slightly different path, which results in a phase shift which depends on the index of refraction of the material. The different optical path lengths will result in waves of certain wavelength to interfere destructively, whereas other do so constructively. This results in certain colors being present in reflection or transmission, and not others, which explains the colors of thin soap or oil films.
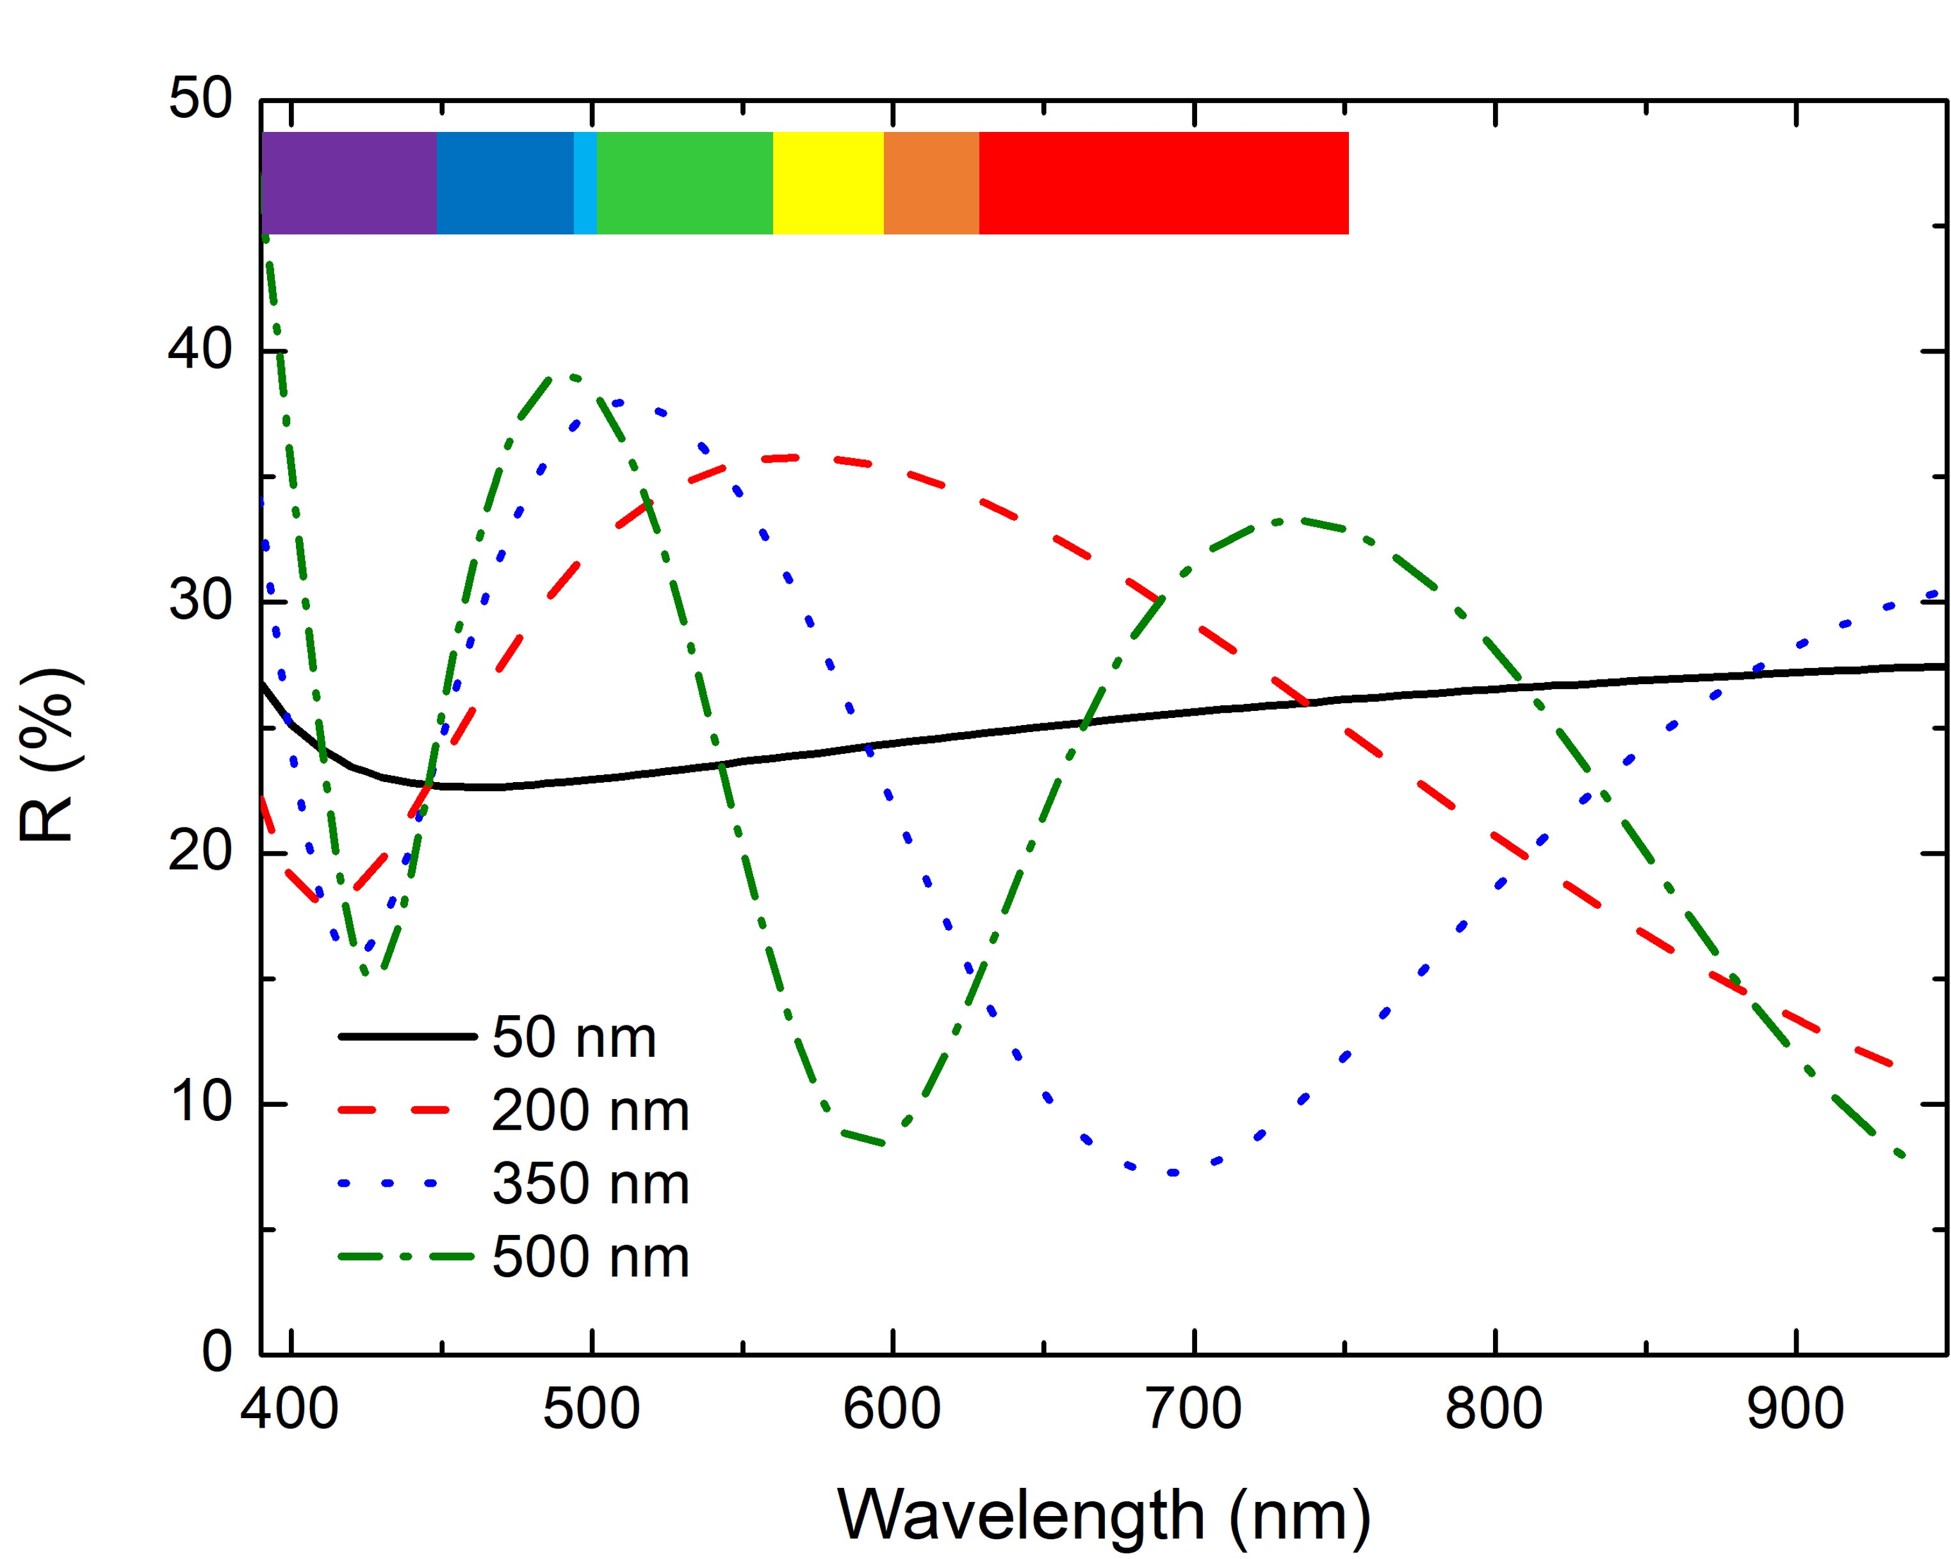
The interference depends on the path length difference between waves, which is evidently related to the thickness of the film. Therefore, films of the same material but different thicknesses may appear different, for example, one may be blue while the other red. This hints at a very powerful tool for thickness determination by optical methods.
In a spectrum—transmission or reflection squared (T and R) as a function of wavelength—the interference manifests itself as oscillations in the spectra. It is possible to use the period of the oscillations (the distance between consecutive maxima or minima) to find the thickness, provided that the index of refraction is known
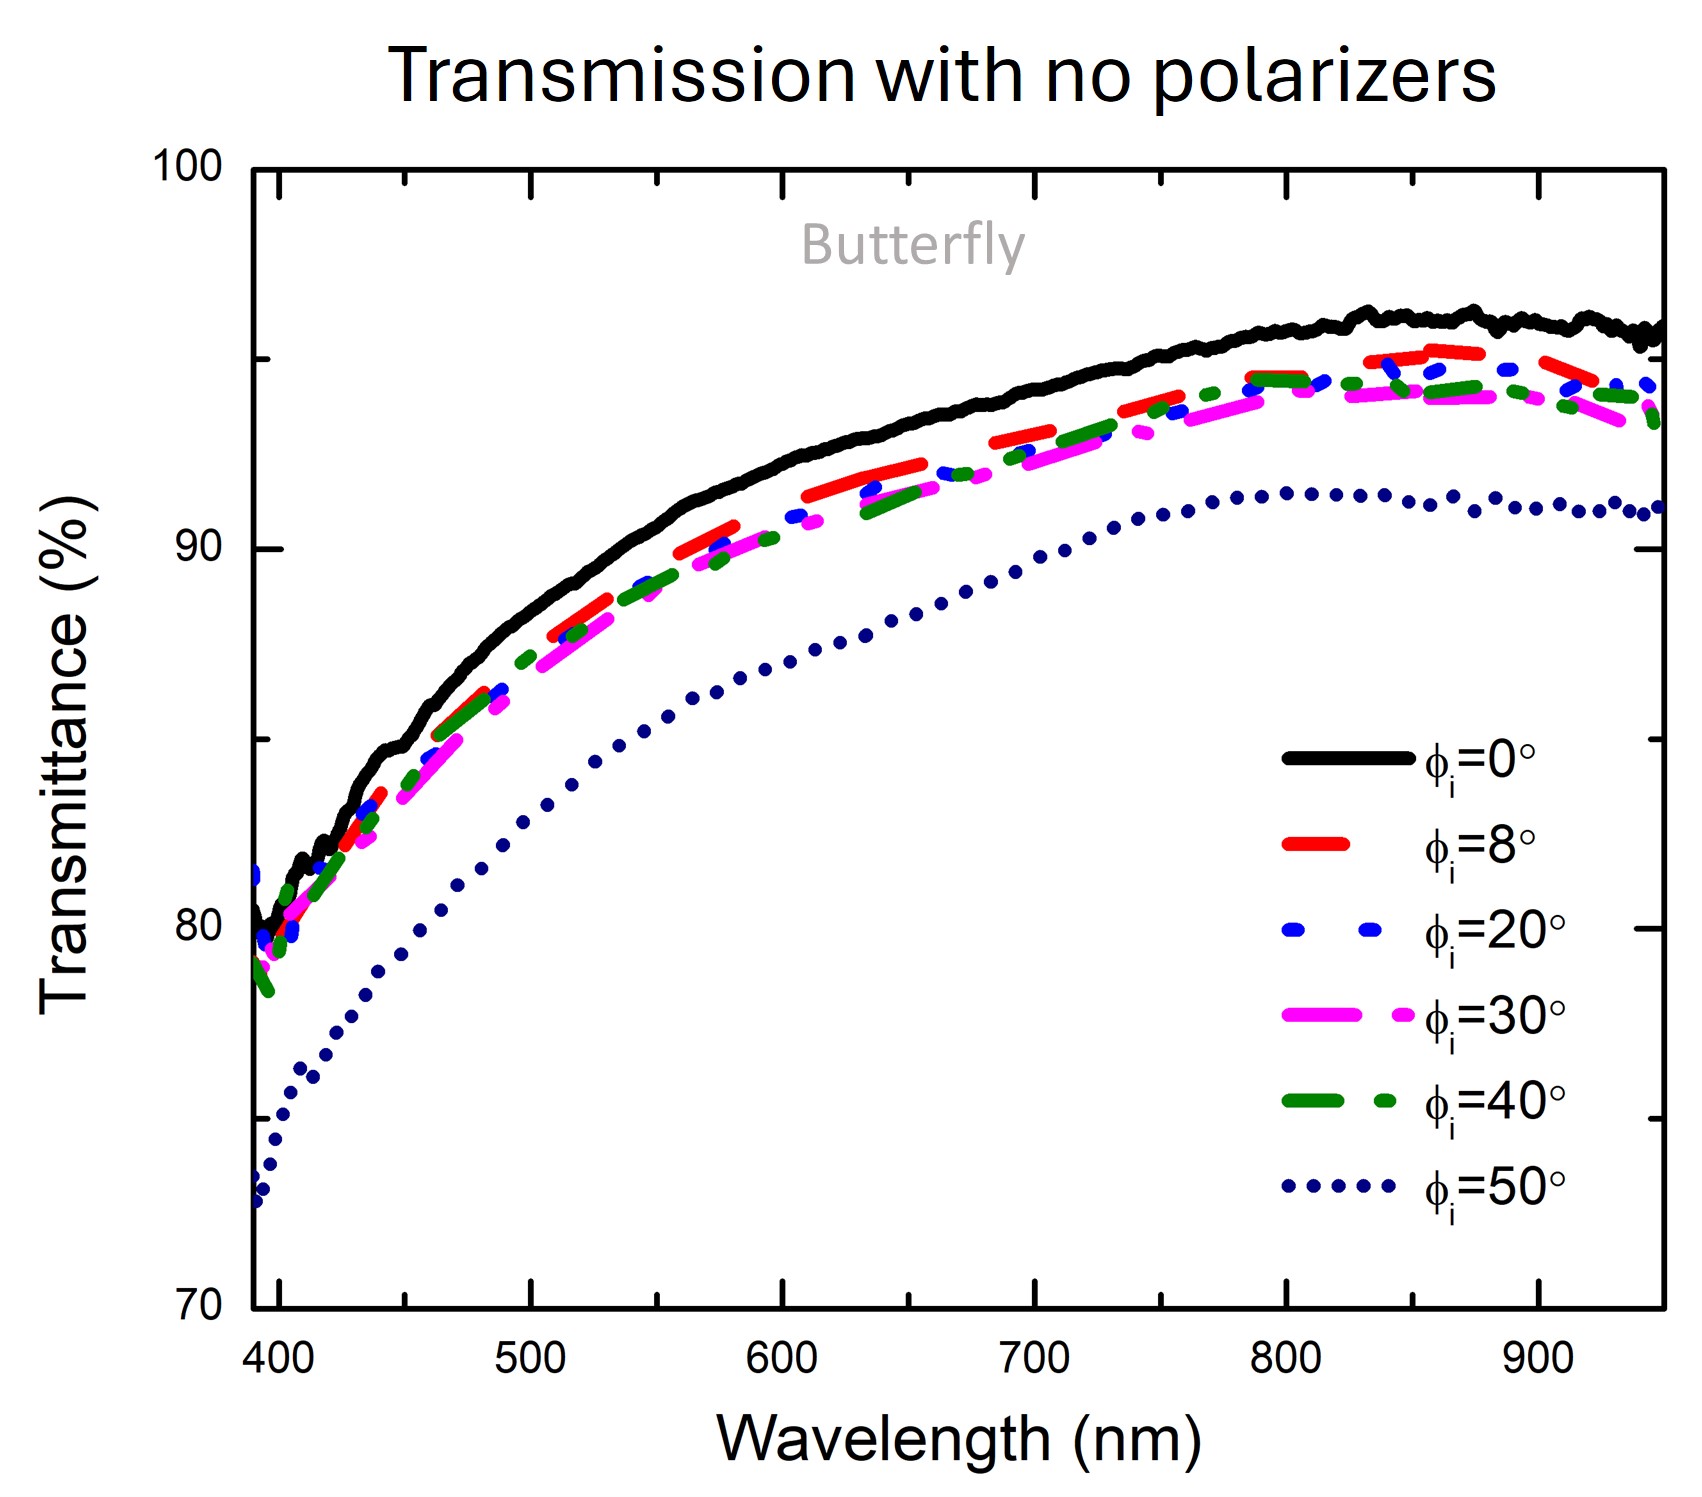
However, in very transparent samples this technique is difficult to apply when measuring transmission, which is the simpler than reflection due to easier alignment. Transparent samples have very low reflections. This in turn makes the first transmission (t1) dominate the spectra, with the rest of the very small fields introducing small oscillations that are not distinguishable relative to the main transmission. It is like having a very small AC signal superposed to a large DC signal. The lack of observable oscillations prohibits the application of the interference technique for thickness determination.
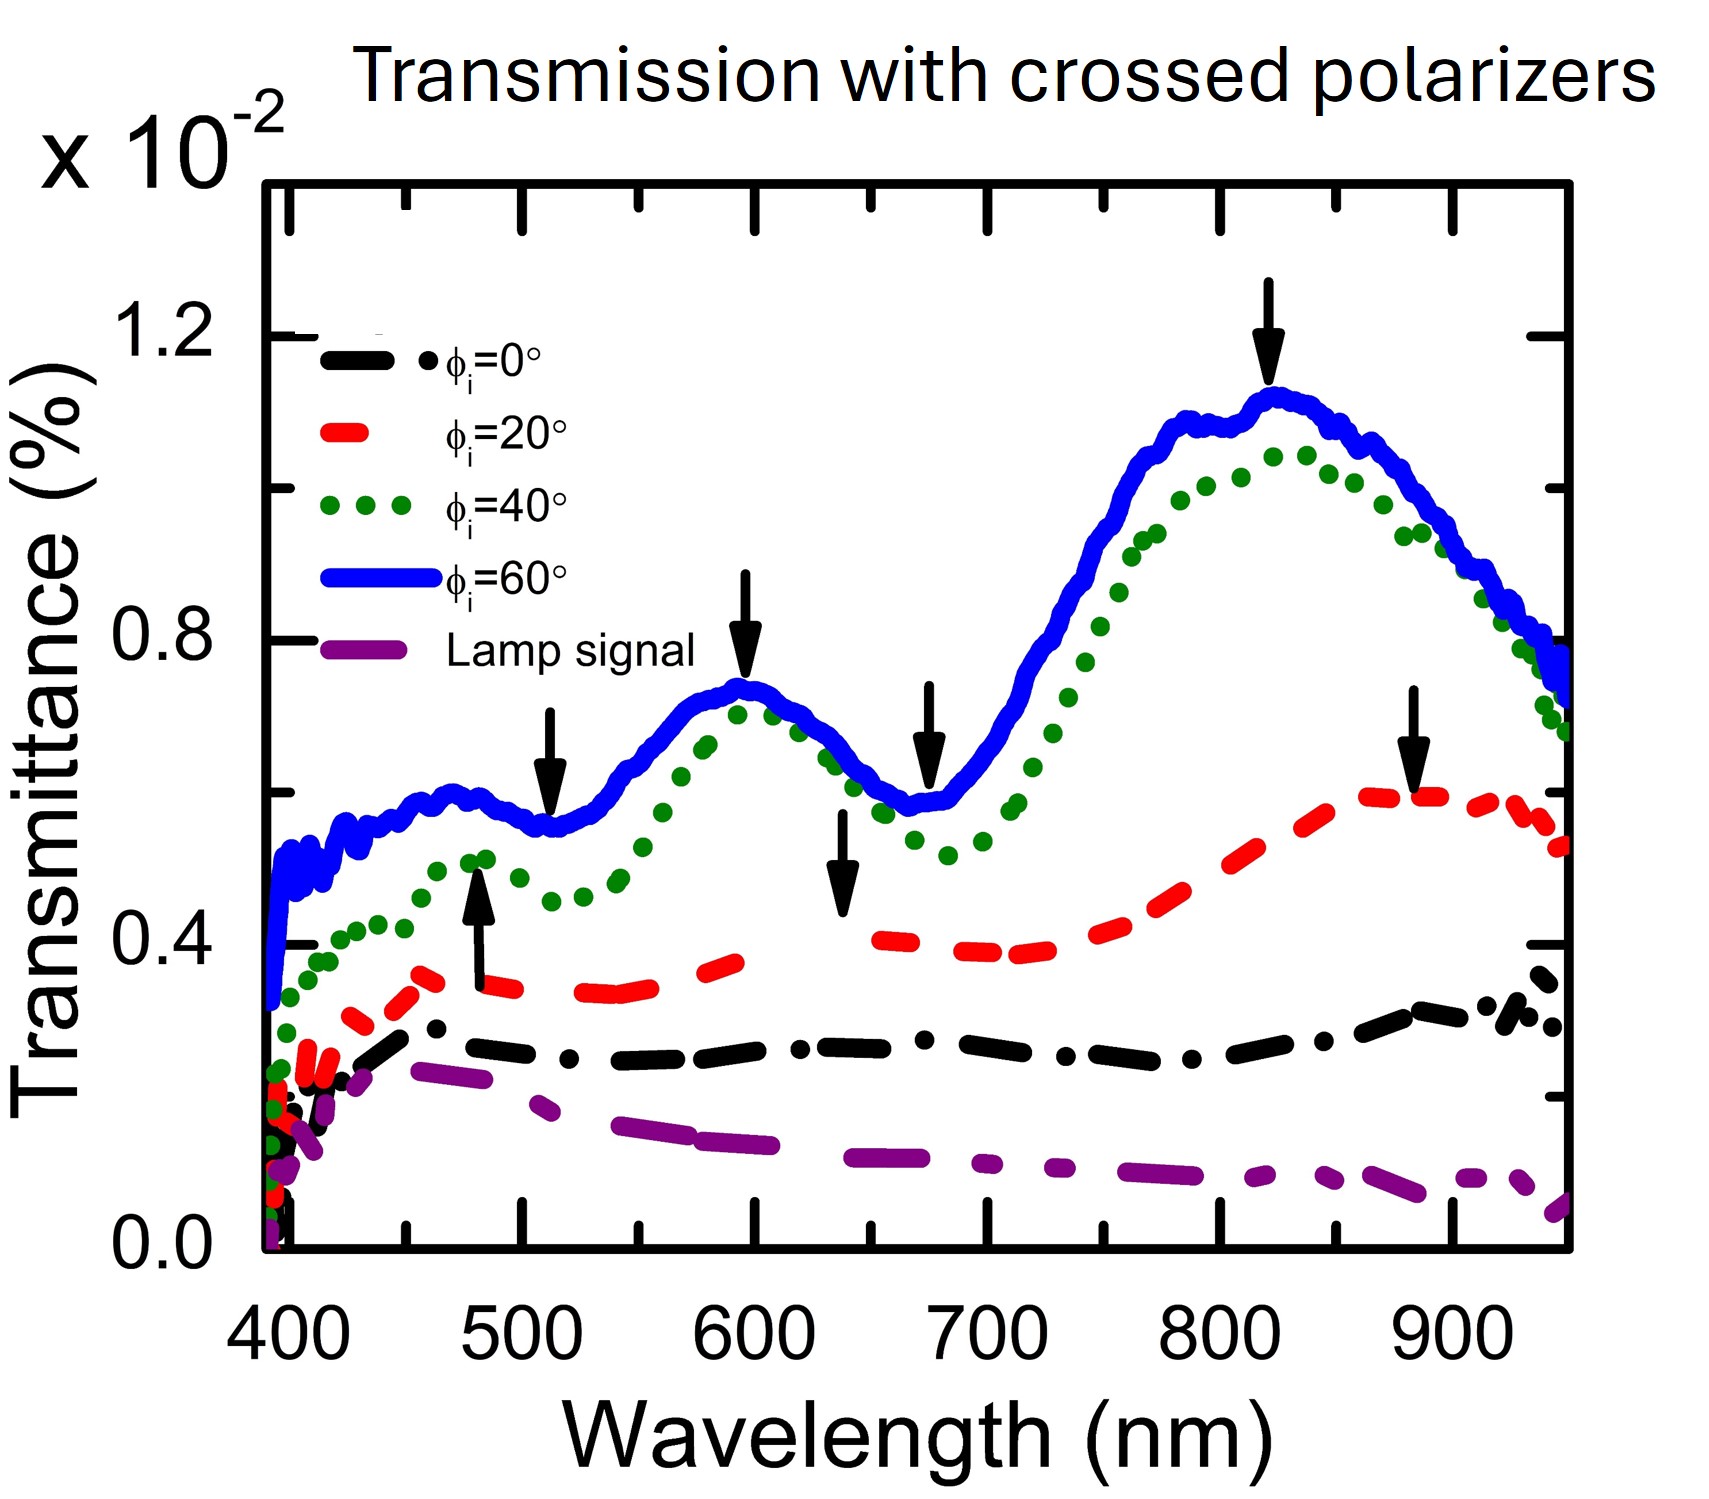
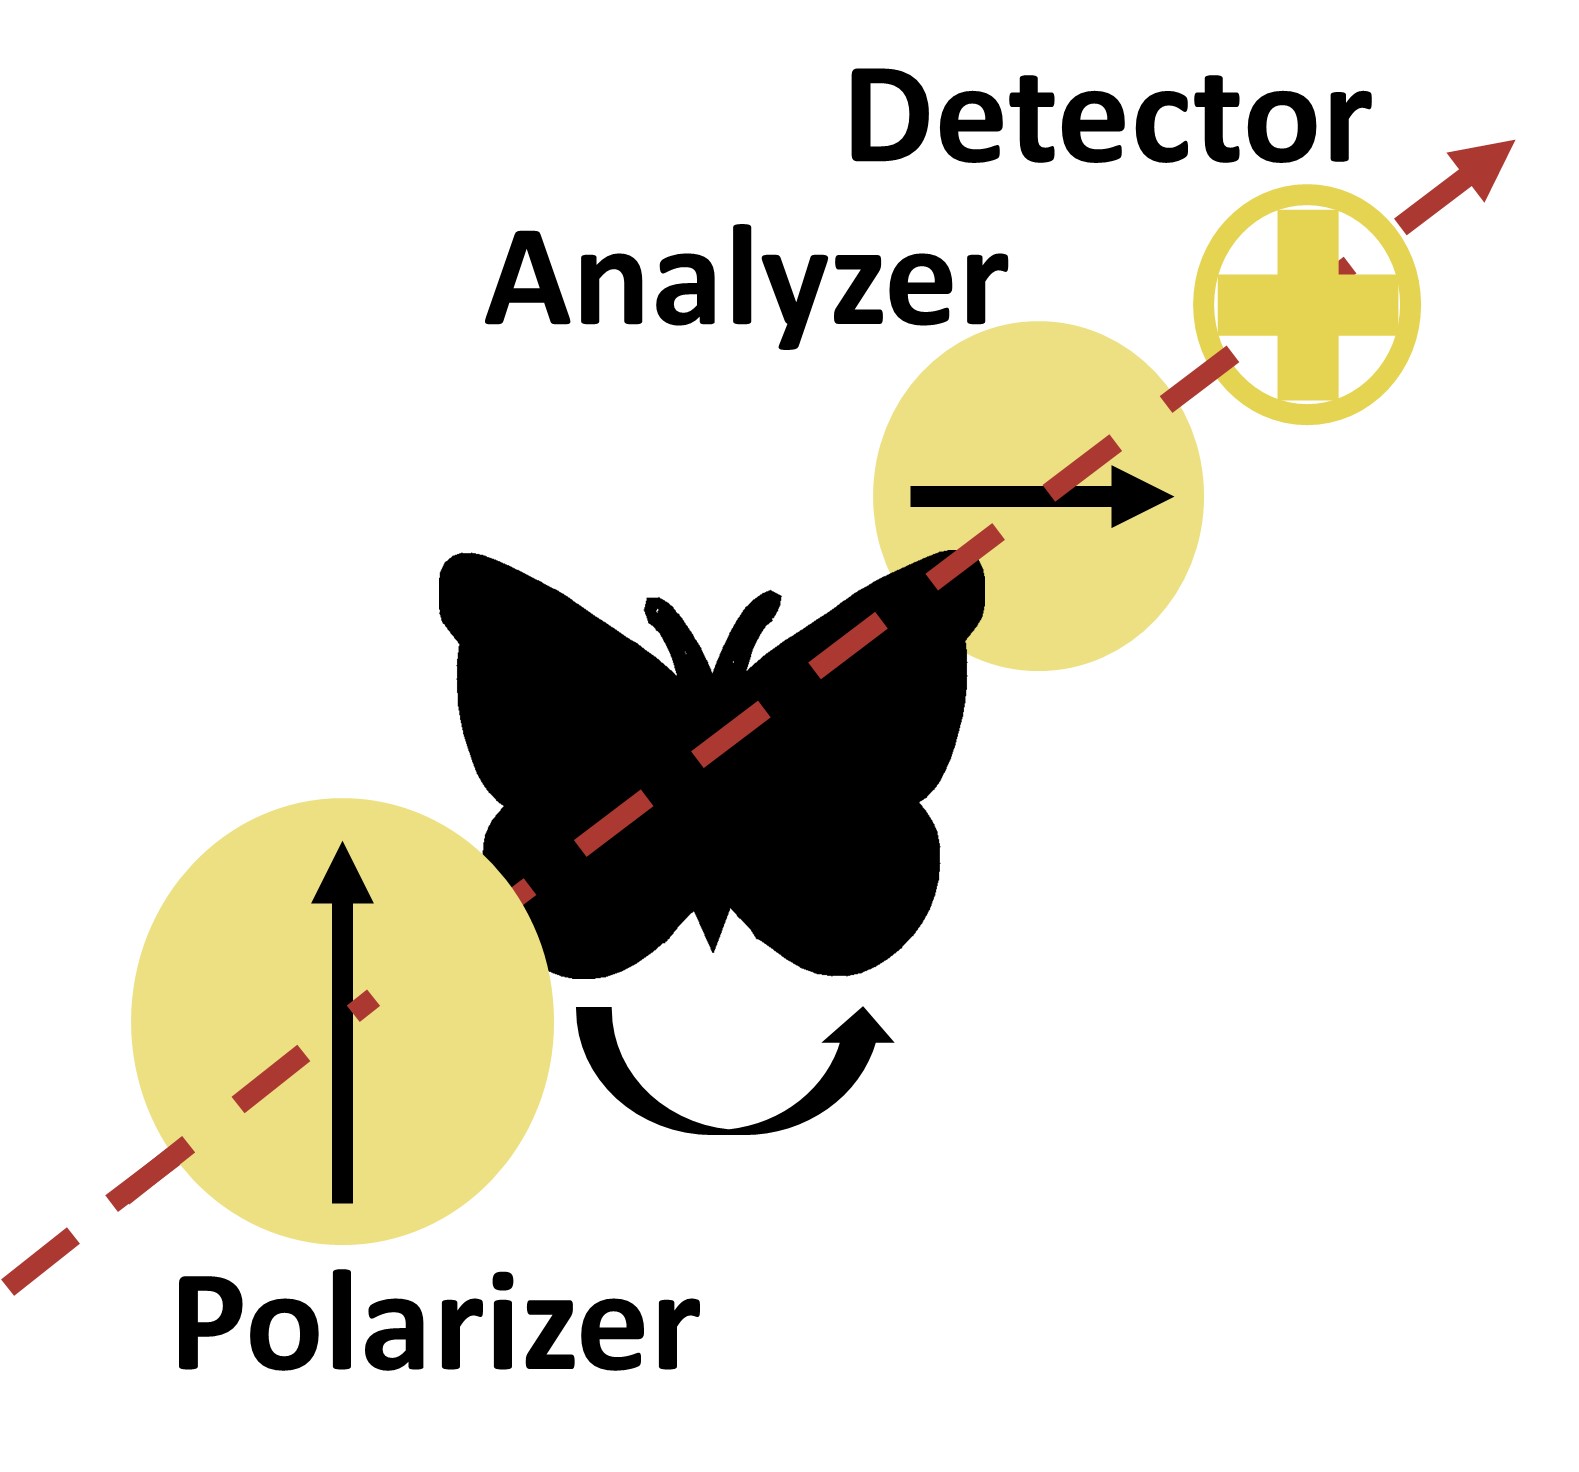
In samples that display polarization conversion effects, this difficulty can be circumvented. These rotate the polarization direction of light (the direction of vibration of the electric field)
The situation is different in samples that have polarization conversion effects. In this case, light passing through the sample may be rotated, and thus there may be some light that is polarized horizontally even though at first it was vertically polarized. How much is rotated depends, again, on the thickness, and how many passes it does through the samples. It is a compounding effect. We can exploit this to unveil the interference oscillations that were hidden in very transparent samples.
The first transmission (t1), which dominated the spectrum without the polarizers, will only pass through the sample once, while the second (t2) passes three times, the third (t3) five times, etc. Therefore, the first component will be rotated very slightly, and will be suppressed by the second polarizer. This eliminates that large signal, allowing for the observation of the interference oscillation produced by the interaction of the other fields of similar strength.
In our recent paper we exploited the polarization conversion effects on the wings of the Episcada hymenaea translucent butterfly